Let’s talk about deep time!
By Hanna Knahl

Figure 1 – This is an artistic way of showing Antarctica’s transition from a warm climate with forest to a colder climate with rising ice 34 million years ago. Source: Created with AI Image Generator
Let’s travel back in time again, dig deep into the sediments and see what face Antarctica wants to show us this time! Is it hot and colourful or cool and icy? Or is it both? My “time machine” will bring us back into a climate full of change and mysteries.

Figure 2 – Brand-new publication about a time full of change and my first co-authorship! Source: Screenshot science.org (adjusted) [1]
Yes, we are travelling in time again! Last time we travelled back 90 million years, now it’s “only” 34 million years – still deep back in time. No clue what that means? No problem, I will show you! This is what I am doing in my PhD almost every day. Now I am part of a brand-new publication about pretty old stuff [1]. This is really exciting as it will show us another astonishing face of Antarctica.
Antarctica has more than one face…

Figure 3 – The mysterious faces of Antarctica
…you already know that. During the last adventure you found that during the Cretaceous (the time of the dinosaurs) Antarctica was not cold and icy but warm and full of life. A temperate rainforest was covering the continent at the South Pole, the “hot face” of Antarctica. This was about 90 million years ago. [2] And today, Antarctica is showing its “cool face” as it is covered by a huge ice sheet. So, somewhere in between there must have been a big change from hot to cold, from forest to ice! This transition happened between the epochs called Eocene and Oligocene. This was 34 million years ago. How might that have looked like? Show us another face, Antarctica!
Veeery old sediments
You already learned about how vegetation and climate in deep time can be recovered from ocean sediments. I showed you how scientists go on ship expeditions and drill in the ocean floor with special devices.
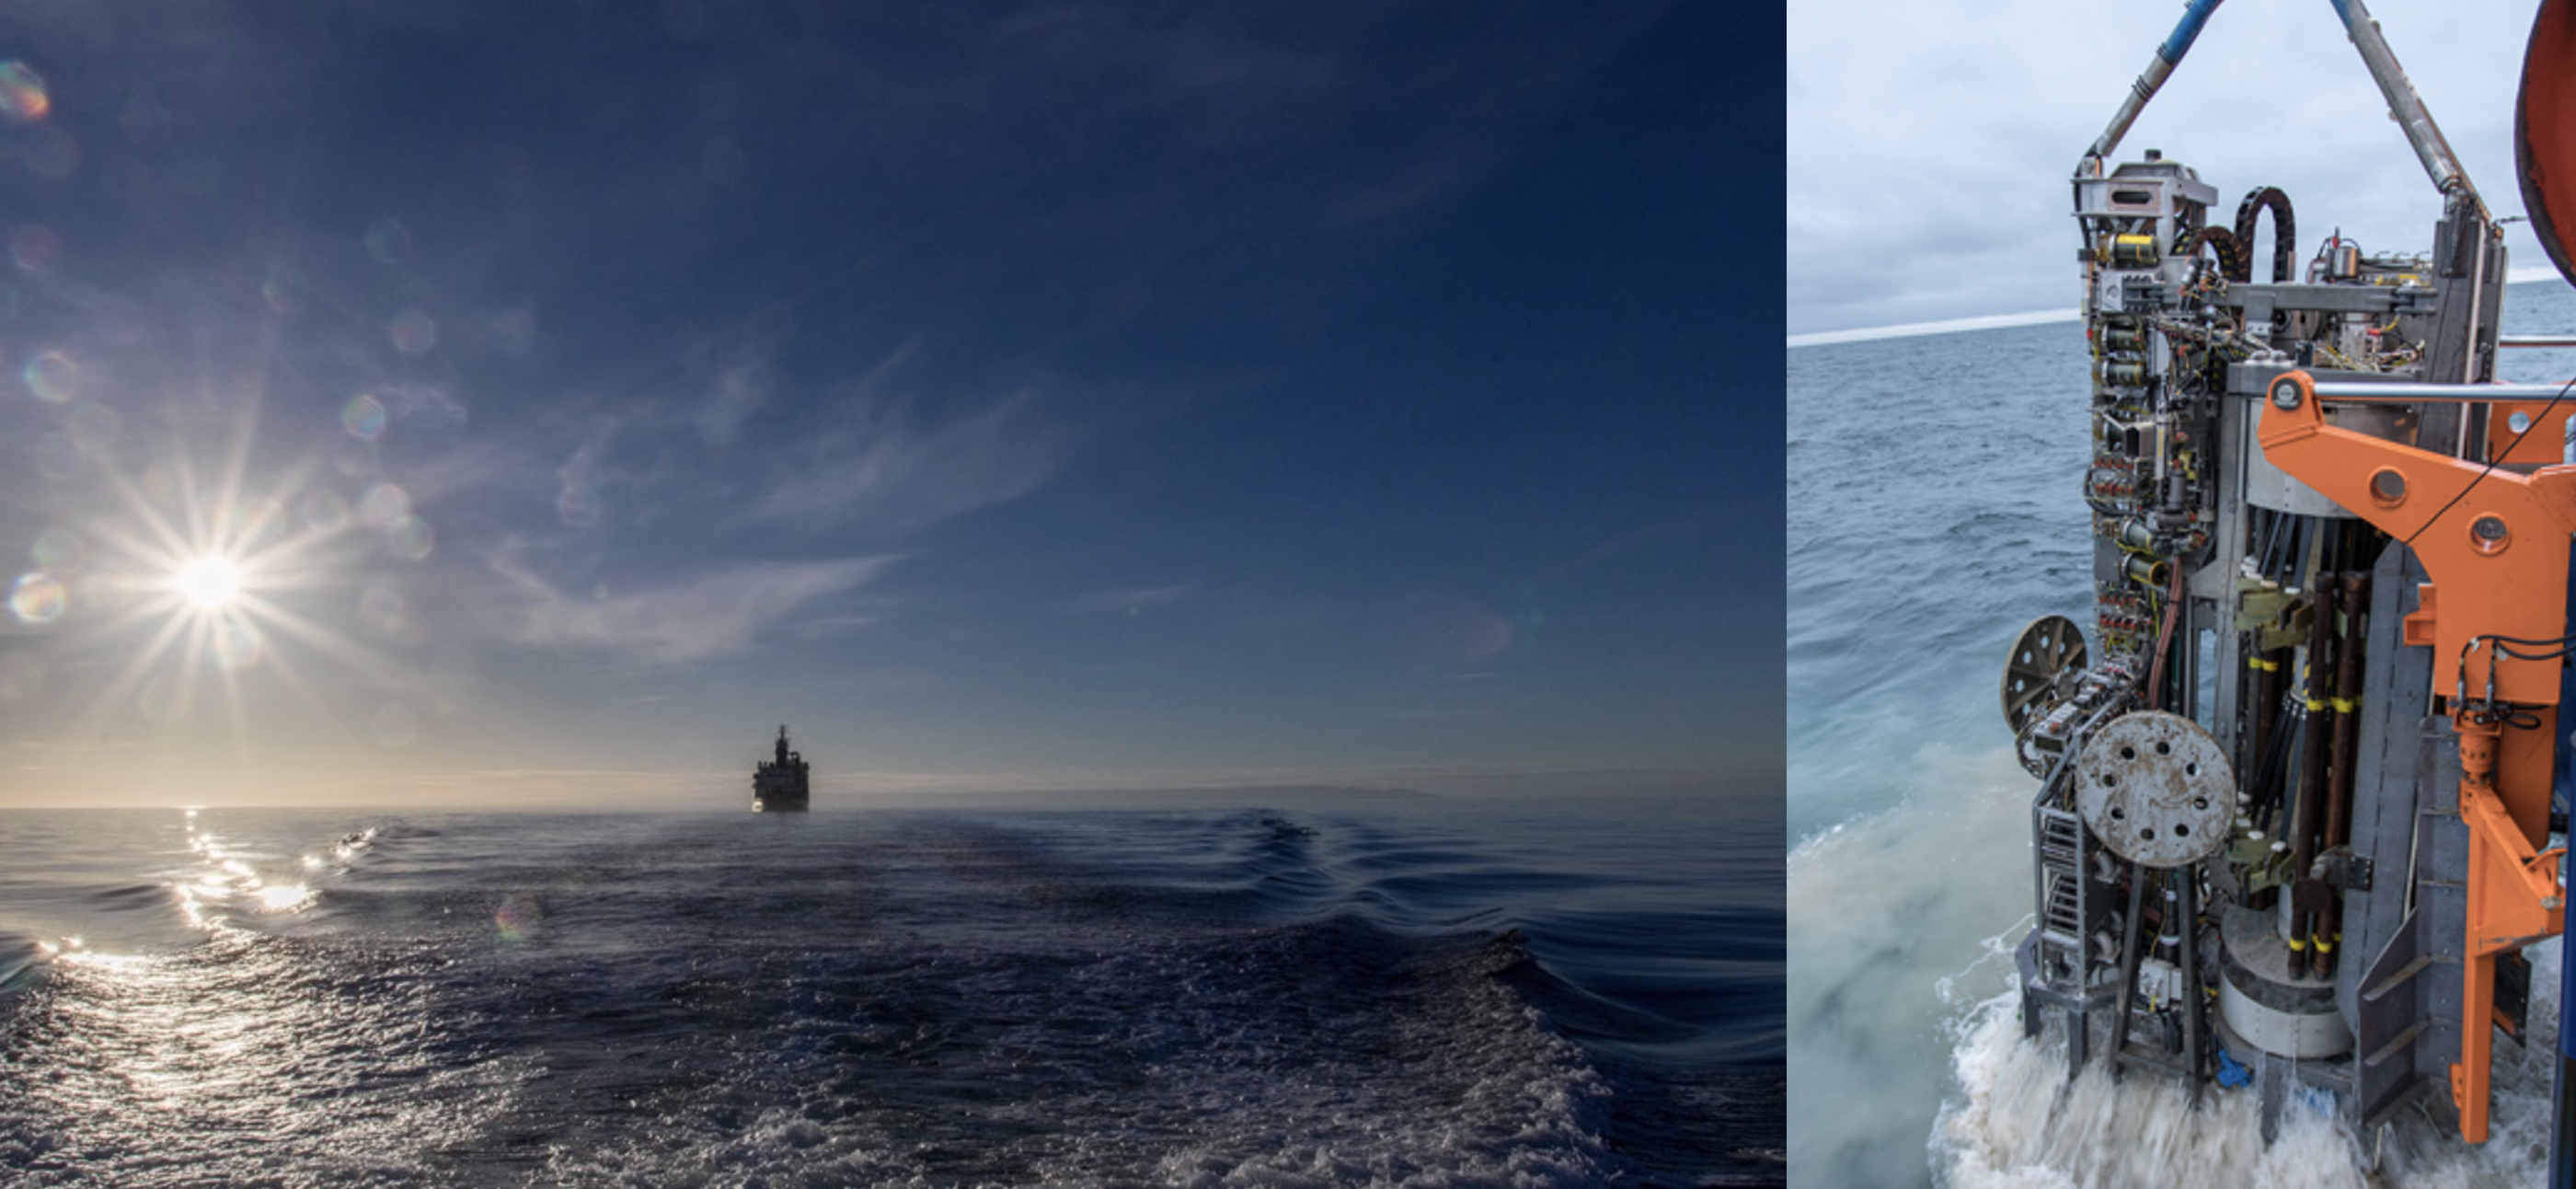
Figure 4 – RV Polarstern expedition PS104 drilled sediment cores in the Amundsen Sea Embayment (West Antarctica). Source: Alfred-Wegener-Institut / Thomas Ronge
That way they are able to reconstruct the local conditions in the past (see table 1). 34 million years ago, temperatures were way above 0°C (the critical threshold to grow ice). So, it was still warm but not as warm as during the Cretaceous. There also was a lot of precipitation in West Antarctica – actually, even more than during the Cretaceous.
Table 1 – Climate parameters retrieved from the sediment cores for the Cretaceous [2] and Eocene-Oligocene-Transition (this article) [1]. CO2 in parts per million by volume (ppmv)
| Climate in West Antarctica | Cretaceous | Eocene-Oligocene-Transition |
| CO2 | ~1000 ppmv | ~500-850 ppmv |
| Temperature (annual mean) | ~13°C | ~7.5°C |
| Temperature (summer) | ~18.5°C | ~12.8°C |
| Precipitation | ~1,120 mm per year | ~1,500 mm per year |
This was not all! The sediment core also shows “no indication of ice presence” close to the drill site in the time of 34 million years ago. This means there cannot have been an ice sheet that reached all the way towards the shore and into the ocean. And therefore, in that ocean basin there have been no rafting icebergs. Instead, on land there was a cold temperate forest like it exists in Patagonia (which is in the very South of South America) today. [1]
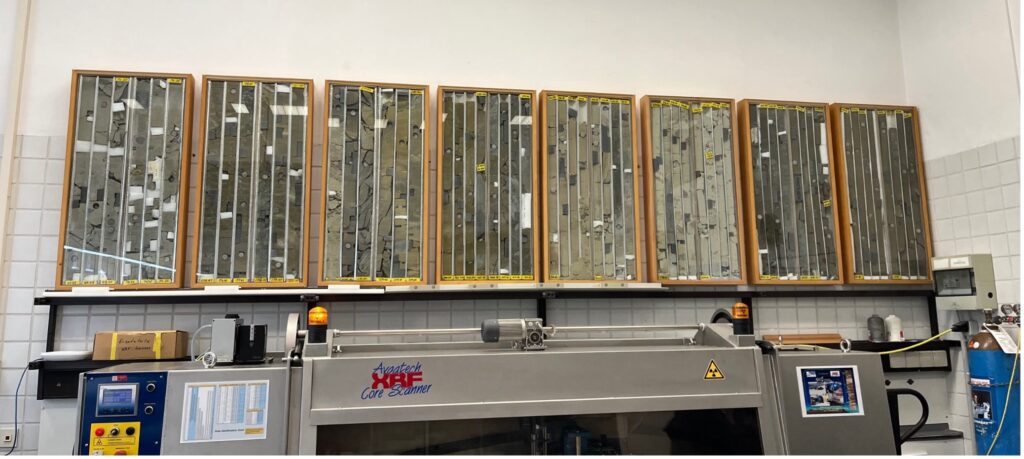
Figure 5 – Here you see a similar sediment core but drilled in another place around Antarctica, the Ross sea. It got its place of honour in the geo science lab at the Alfred-Wegener-Institute in Bremerhaven. It is cropped in pieces of 1 metre lentgh to make it easier to handle. Starting with the youngest sediments from the left to the oldest (Eocene) on the right. Source: Own picture
So far so good, but why is that so interesting?
We know from other studies that the CO2 concentration and the temperatures dropped remarkably during that time. [3] Colder temperatures gave way to grow ice. And we actually see from isotope reconstructions on fossilized marine organisms that ice must have grown – somewhere. [4] The question is: WHERE?
We know that West Antarctica is more vulnerable to warm temperatures than the East. What do I mean by West and East when we talk about the South pole? Have a look in Figure 6. In the West we see large ocean basins and fewer land above sea level than in the East. In warm climates not only the atmosphere is warm but also the ocean stores a lot of heat. This heat storage is very powerful and makes it much more difficult to grow and sustain an ice sheet in the West compared to the East. So, we asked ourselves:
Has there been an ice sheet in East Antarctica while the West of the continent remained ice-free?
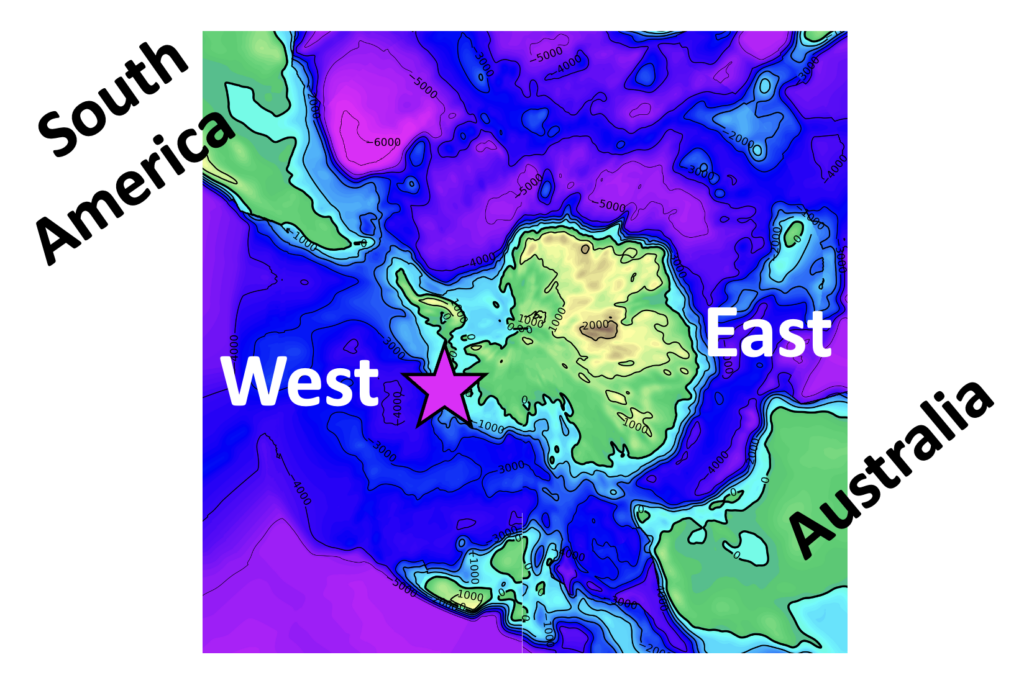
Figure 6 – Antarctic topography 34 million years ago. By West Antarctica I mean the left half of which is close to South America Antarctica – i.e., west of the 0° Greenwich meridian. By East I mean the other half close to Australia. The pink star marks the drill site of the sediment core. Source: Own figure made from [5]
What would time travelling be without a time machine?
How to tackle this question? We wanted to get a picture of the whole Antarctic continent. And to be honest, what would time travelling be without a time machine? This is why I started to simulate the “face” of Antarctica with my time machine – a climate model.
My “time machine” has the long name Alfred-Wegener-Institute Earth-System Model (AWI-ESM-2.1) and the Parallel Ice Sheet Model (PISM). It looks like sketched in the following figure:
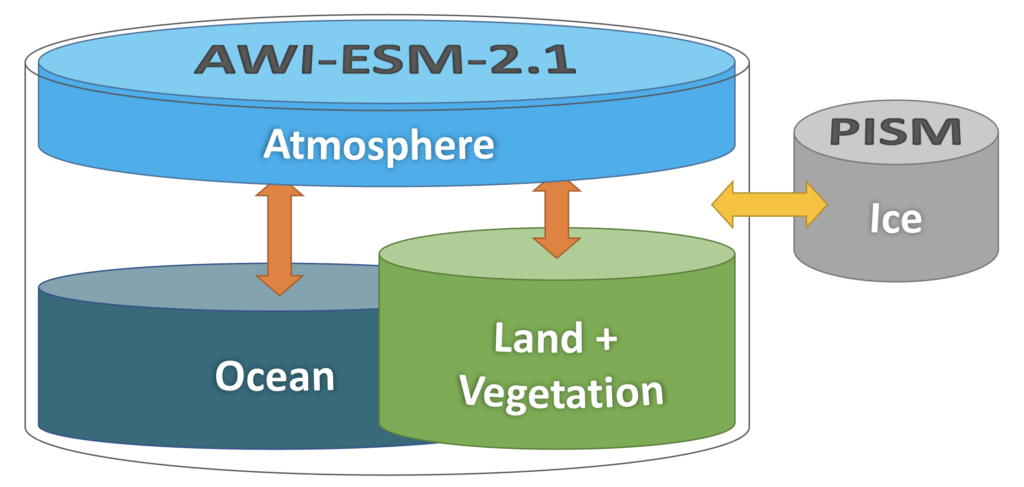
Figure 7 – AWI-ESM 2.1 simulates the climate, where ocean, atmosphere and land interact with each other. PISM simulates the ice sheet. Both models are enabled to communicate with each other. Source: Own figure
It is a computer model which uses mathematical equations that describe the dynamics of the ocean, atmosphere, land surface, and ice. The arrows indicate that all of the different components interact with each other, so they see what the others are doing and adapt accordingly.
Ready for take-off?
When I let my model run, it takes me back to a climate which is much warmer than today, but colder than during the Cretaceous. So, we don’t find temperate rainforest anymore but cold temperate forest and shrubs in the West matching evidence from the fossil remains found in the sediment. However, when we look into East Antarctica the model shows a well-developed ice sheet there! (See Figure 8)
Yippie, our question is answered!
At least for this model and this set up. As always in science there are uncertainties. Different models and set ups show very different sizes of the ice sheet at that time. This is because we still have gaps in our knowledge about the conditions and the timing of the transition from hot to cold climate. Also, strengths and foci differ between climate models. Nevertheless, my model results in comparison with data from sediment cores take us a step further in narrowing down our knowledge gaps in this special time full of change and thus make numerical models for high-CO2 simulations more reliable.
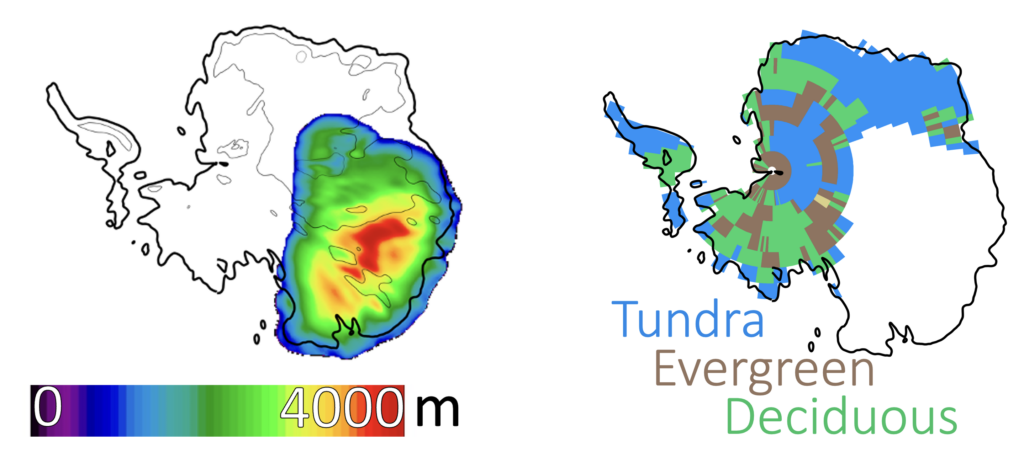
Figure 8 – Ice sheet thickness (left) and vegetation type (right) simulated by the climate model. Source: [1] Modified
For example, you might think the ice begins to grow at the highest mountains in the East where it is the coldest. No, we see that the ice actually begins to grow close to the coast on land where – at the same time – the Transantarctic Mountains start to rapidly grow. Why is that? You already learned in the article about the Cretaceous that you don’t only need cold temperatures to grow an ice sheet but also precipitation. When there is no snow, it can be as cold as it wants but it will not form an ice sheet. This is the effect we see in the model. Only at the coast there is enough precipitation to start the process of ice sheet build up where each layer of snow sits on top of the previous one.
It grows until a size equivalent to about 35 metres of sea level, which means: If the ice would melt, the global mean sea level would rise by about 35 metres. For today’s Antarctic ice sheet this value is about 58 metres. [6] So, the modelled East Antarctic ice sheet is already quite huge and has a big impact on local and global climate. But this will be part of future research;)
A new face of Antarctica revealed

Figure 9 – The face of Antarctica when the ice began to grow. Source: Modified after generating with AI
With joint powers, sediments and model simulations again revealed a new face of Antarctica. During the transition from hot to cold climate, Antarctica shows us a face of both – ice and vegetation. While the West still hosts cool-temperate vegetation and mild temperatures, the East already shows a nicely developed ice sheet. This transition continued and finally gave way to the huge ice sheet covering the whole continent as it does today. Let’s do our best to preserve this wonderful old ice sheet!
Touch down to the present…
Sources
[1] J. P. Klages et al., Ice sheet–free West Antarctica during peak early Oligocene glaciation. Science 0, eadj3931 DOI:10.1126/science.adj3931
[2] Klages, J.P., Salzmann, U., Bickert, T. et al. Temperate rainforests near the South Pole during peak Cretaceous warmth. Nature 580, 81–86 (2020). https://doi.org/10.1038/s41586-020-2148-5
[3] Hutchinson, D. K. et al. (2021). “The Eocene–Oligocene transition: a review of marine and terrestrial proxy data, models and model–data comparisons”. In: Climate of the Past 17.1, pp. 269–315. doi: 10.5194/cp-17-269-2021.
[4] Bohaty, S. M. et al. (2012). “Foraminiferal Mg/Ca evidence for Southern Ocean cooling across the Eocene–Oligocene transition”. In: Earth and Planetary Science Letters 317-318, pp. 251–261. issn: 0012-821X. doi: 10.1016/j.epsl.2011.11.037.
[5] Paxman, G. J. G. et al. (2019). “Reconstructions of Antarctic topography since the Eocene-Oligocene boundary”. In: Palaeogeography Palaeoclimatology Palaeoecology 535.109346. doi: 10.1016/j.palaeo.2019.109346.
[6] IPCC, 2019: Climate Change and Land: an IPCC special report on climate change, desertification, land degradation, sustainable land management, food security, and greenhouse gas fluxes in terrestrial ecosystems [P.R. Shukla, J. Skea, E. Calvo Buendia, V. Masson-Delmotte, H.-O. Pörtner, D. C. Roberts, P. Zhai, R. Slade, S. Connors, R. van Diemen, M. Ferrat, E. Haughey, S. Luz, S. Neogi, M. Pathak, J. Petzold, J. Portugal Pereira, P. Vyas, E. Huntley, K. Kissick, M. Belkacemi, J. Malley, (eds.)]. In press.
- 2 Klicks für mehr Datenschutz: Erst wenn Sie hier klicken, wird der Button aktiv und Sie können Ihre Empfehlung an Facebook senden. Schon beim Aktivieren werden Daten an Dritte übertragen – siehe i.nicht mit Facebook verbunden


This article offers a fascinating journey into Antarctica’s past, showcasing the incredible shifts in its climate over millions of years. From the warm, temperate rainforests of the Cretaceous period to the icy landscapes we associate with the continent today, it’s amazing to see how much has changed. The research highlighted in the article brings these ancient worlds to life, providing a vivid picture of what Antarctica looked like 34 million years ago.
One can’t help but draw parallels between this exploration of deep time and the evolving landscape of digital marketing, where Influencer Codes are increasingly shaping the terrain. Just as the sediment layers reveal the hidden history of Antarctica, these codes offer insights into the latest trends and strategies in influencer marketing. By decoding these signals, brands and marketers can better navigate the complex world of digital influence, much like scientists uncovering the secrets of Earth’s ancient climates.