
A student asked me recently how to prepare good presentations, “as in your lectures!”. Beside being really touched by the fact that she liked my presentations, in fact I do have some tips, which I acquired over time.
- You need to address two different senses of your audience. Assuming a typical slide-based presentation, this would be hearing and seeing. Your audience listens to what you are saying and they see what you have on your slides. However, the problem is when the slide is full of text. Psychological studies have shown that reading text and hearing text is processed by the same area in the brain. This means that you double occupy this region when you offer text on your slides. Think of your own experience: When I see text on a slide, I try to read it, but this occupies my full attention and I stop listening. So, you need always to make sure that the audience is not currently occupied with reading when you explain something.
Look at the following two slides – which one is nicer to look at?
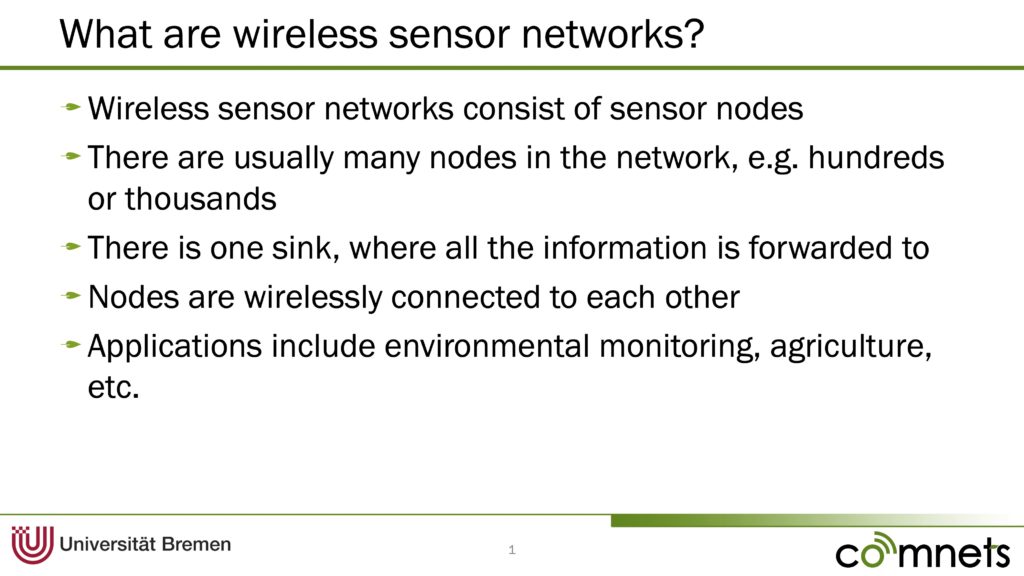

However, now it becomes crucial what you say. With the first slide (the text one), you can say anything you want, since the audience is not listening at all and struggle to read your text. With the second one, you need to explain everything on the picture. Best, you introduce the individual items (the nodes, the sink, the wireless links, application) one by one with an animation. Note the arrows and the definitions, they are important!
- Identify the goal of your presentation! Is it to show new results? Is it to teach something? These two need completely different approaches (maybe I will write about those in the near future…). I general, when teaching, you would use much more text for the people to have a reference later. However, in the best of all worlds you would have a proper presentation for class and handouts/scripts for home and reference. With research results (also from student projects!) you would focus on numbers and important definitions (e.g. a legend).
- Sometimes you need to present difficult stuff: a complex equation or graph. Make sure to present it step by step, for example like in this slide:
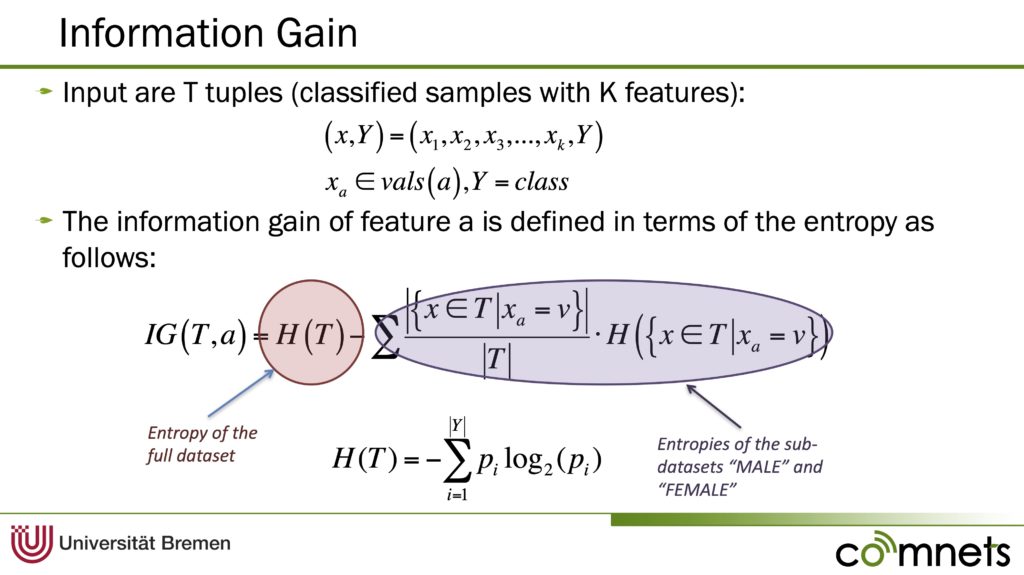
Here, I have used an animation, which shows each line separately, so that I have time to explain it. Especially when it comes to the complex equation at the bottom, I go slowly one spot at a time and give intuition behind what is going on. Do not rely on laser pointers for this! They shake when you are nervous, they are not well seen and people do not know what are you showing them.
You should use the same trick with animations, arrows and spotlights also to present graphs – show the people what exactly they should look at.
- Build a story. A presentation is not a historical overview and does not have to follow the sections of your research paper. You should also focus on some of your results, not all. You can build the story also visually, see this slide:
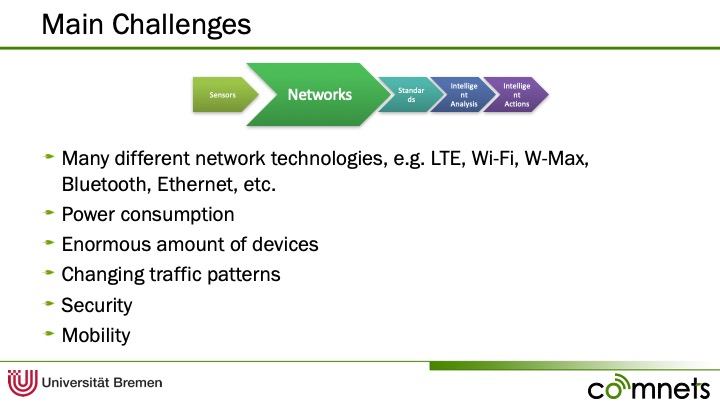 The colourful legend at the top is not only part of the title of this slide, but also tells the audience where we are in the story. Some people also do this with a normal table of contents. In this slide, you can also see how text can work – you simply need to introduce the bullet points one by one and to have them short.
 - Focus your text on what is really important, do not waste the reading time of your audience with full sentences, conclusions, etc. At the same time, make sure that all important stuff, like mathematical definitions, colours used for coding something, axes on the graph, etc, are always clear. You can easily do this by offering a small legend at each slide.
I would really like to hear from you! Let me know whether you found this useful and what tricks do you have!
Thank You For Sharing ……